
Lean production
How do you build a production loss matrix?
A loss matrix links production losses to the functions capable of resolving them. By combining loss type, cause, and ownership, it becomes easier to prioritise actions and track them from analysis through to verified results.
Text by Robin Ottenfelt · CMO
Fact-checked by Mikael Persson · Co-founder and CEO ·
Published · Last updated
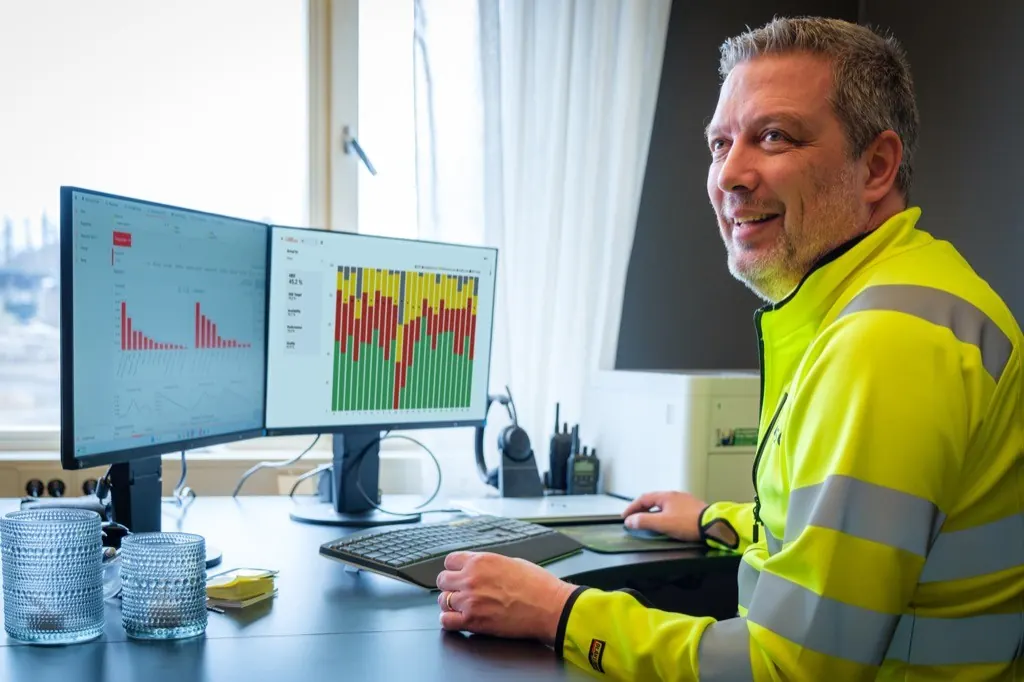
The loss analysis shows what needs to be investigated. The loss matrix links the follow-up to the right function and responsibility.
A material shortage ends up in the production report. A technical breakdown is sent to maintenance. A lengthy changeover is discussed at the morning meeting. But who takes the next step when the issue spans multiple functions?
A loss matrix brings clarity to ownership and cross-functional collaboration. It highlights which types of losses occur and identifies which function should lead efforts to reduce them. The matrix is used to select problems, gather the right team, and monitor whether countermeasures actually drive down losses.
What is a loss matrix?
A loss matrix combines two perspectives: how production loses capacity and which functions can influence the underlying causes. Rows can represent loss categories or specific downtime reasons. Columns can represent production, maintenance, internal logistics, quality, planning, and product development.
For each relevant combination, you show the scale of the loss and designate who leads the follow-up. This allows work to be distributed across functions and ensures accountability for completed actions.
Distinguish loss type from cause and root cause
A machine stands idle for 25 minutes due to missing material. The downtime is the loss. Material shortage is the observed cause. Why the material was missing requires investigation: was it a missed replenishment, incorrect stock balance, supplier discrepancy, or a changed production plan?
The initial reason code helps steer your analysis. It does not prove which function caused the problem. Responsibility in the matrix should define who leads the investigation and corrective actions, supported by other relevant stakeholders.
Build the matrix in five steps
Establish the loss model. Start with clear categories for breakdowns, changeovers, speed losses, and quality losses. Micro-stops can be shown separately in the analysis but must not be double-counted.
Select actionable causes. Break down broad categories until they point to an investigable problem. Maintain a structure that operators can use consistently.
Assign each cause to a lead function. Also specify who needs to collaborate. When a concrete action is decided, assign it to a named owner.
Quantify the impact. Use metrics such as lost time, event count, scrap, or estimated cost. Compare within the same period using consistent definitions.
Track the outcome. Verify in the data whether the addressed loss decreases and ensure the improvement sustains under comparable operating conditions.
Example mapping of loss to ownership
The following is an illustrative example. Tailor ownership to your organisation and the root causes identified during investigation.
Observed cause | Leads follow-up | Collaborates with |
|---|---|---|
Missing material | Internal logistics | Production and planning |
Recurring technical fault | Maintenance | Operator and production |
Lengthy changeover | Production | Maintenance and planning |
Start-up scrap | Quality | Production and process engineering |
Waiting for runnable order | Planning | Production and order management |
Recurring speed loss | Production | Process engineering, maintenance, and quality |
When an investigation reveals that the root cause lies elsewhere, the lead is handed over or shared. The matrix must support swift team action, even when the initial assessment needs to be adjusted.
How do you prioritise between losses?
Begin with the losses that have the greatest impact on operational goals. One hour of downtime at a bottleneck can affect delivery volume far more than several hours on a resource with ample spare capacity.
Evaluate the scale, the impact on delivery and quality, potential financial gains, and the effort required. A cost calculation must differentiate between capacity released and direct costs that can actually be eliminated. Lost hours do not automatically convert to equal cash savings.
Select a few priorities at a time and secure the necessary time to execute them. Read more about how loss analysis provides the baseline for your choices.
From observed loss to ownership
Example: who leads the initiative when the line runs out of material?
Turn every prioritised loss into an actionable task
The matrix shows where ownership sits. The action plan outlines what needs to be done. For each prioritised problem, the plan should include:
Loss, resource, and baseline over a specified period.
Investigated root cause and selected countermeasure.
Designated owner, participating functions, and completion date.
Target reduction for the targeted loss.
Timeframe and methodology for verifying the outcome.
Standard operating procedures, checks, or maintenance routines to be updated.
Track short-term deviations in daily management. Use continuous improvement meetings for recurring causes requiring deeper analysis and cross-functional collaboration.
What insights does the Good Solutions platform provide?
The Good Solutions platform provides a solid foundation through logged machine events, operator reason codes and comments, and loss analysis segmented by line, part number, shift, and timeframe. Reports and trend visualisations help teams prioritise and monitor whether a specific loss is decreasing.
The loss matrix presented here is an organisational working method. It can be populated with data from the platform and managed on a shared dashboard or action board. Read more about reports in the Good Solutions platform and continuous improvement.
Frequently asked questions
What is the difference between a loss model and a loss matrix?
A loss model defines how losses are categorised. A loss matrix links these categories or causes to specific functions, ownership, and scale to make improvement work easier to allocate and organise.
Should maintenance be responsible for all production stops?
No. Downtime can stem from material issues, planning, changeovers, or quality defects. The function best suited to lead the investigation takes ownership of the follow-up, supported by other relevant teams.
Is a reason code the same as a root cause?
No. A reason code typically reflects the observed symptom of the stoppage. A root cause analysis is required to understand why the issue occurred and determine which actions will prevent it from recurring.
How do we know the matrix delivers results?
Prioritised issues should have clear owners and defined actions, and the targeted losses should decrease under comparable operating conditions. You should also track the impact on delivery performance, quality, and resource utilisation.
Read more
What is loss analysis and how do you use it in production?
Loss analysis involves breaking down production losses by cause, line, article, shift, and time, so that the factory knows exactly where capacity and money are being lost. The analysis is what makes an OEE figure useful: the figure shows that losses exist, while the analysis shows where, when, and why. It is the loss analysis that allows improvement efforts to be targeted at the most costly losses first, rather than those that are simply the most visible.
How do you work with continuous improvements in production?
Continuous improvement means that the factory systematically and continuously identifies losses, addresses root causes, and ensures that the improvements are sustained, in small steps that never end. The work is driven in a recurring improvement cycle: measure, analyse, prioritise, act, and follow up. The OEE system is one of the tools needed in the work on continuous improvement. The OEE system provides factual basis for the improvement cycle, as it shows where the losses are, how large they are, and whether the measures have had an effect.
Take the first step towards increased productivity
Book a demo, and our experts will present a concrete plan to increase productivity, reduce resource use, and achieve profitability and sustainability targets.
Or call us and we will help you
© 2026 Good Solutions Sweden AB