OEE
What is OEE and how is it calculated?
OEE consists of three multiplied subcomponents: Availability × Performance × Quality. For example, 85% availability, 98% performance, and 97.5% quality result in an OEE rate of 81%.

The calculation example: 85% availability, 98% performance, and 97,5% quality result in an OEE of 81%.
OEE, Overall Equipment Effectiveness, is one of the most widely used key performance indicators in the manufacturing industry. A single figure between 0% and 100% is intended to summarise how well a machine, a line, or an entire factory utilises its potential. However, many use the metric without fully understanding what it measures, how it is calculated, or what a good value is in practice.
This guide goes through OEE from the ground up. We explain what the metric comprises, how to calculate it step by step, what lies behind the figure, and why "world-class at 85%" is a myth that misleads production managers. Once you have read this article, we recommend reading the second part, which explains why OEE is not enough as a standalone KPI and walks through how the metric should be used to drive improvement.
What is OEE?
OEE stands for Overall Equipment Effectiveness. The metric originated in the 1980s within Total Productive Maintenance (TPM) and has since become the standard for measuring how effectively production equipment is used.
The metric answers a simple question. Out of the time the equipment could be producing, how much does it actually produce at the right speed and quality?
OEE consists of three components that we multiply together:
OEE = Availability × Performance × Quality
Availability measures how much of the planned production time the machine was actually running. Stops, both planned and unplanned, reduce availability.
Performance measures how fast the machine was running. Speed losses, micro-stops, and idling drag down performance.
Quality measures the share of produced units that met the quality requirements. Scrap and rework lowers the quality.
Since we multiply the three components rather than add them, a small deficiency in any one area can result in a large overall loss. Three sub-values of 90% result in an OEE of 73%, not 90%. This is one of the most important insights of the entire OEE model. The losses amplify each other.
How do you calculate OEE?
The basic formula looks like this:
Availability = operating time ÷ planned production time
Performance = (actual production × ideal cycle time) ÷ operating time
Quality = good units ÷ total units produced
A calculation example. A line is planned to run for 8 hours (480 minutes). Due to downtime, it ran for 408 minutes. This gives an availability of 85%. During the operating time, it produced 800 units. The ideal cycle time is 0.5 minutes per unit, which corresponds to 816 possible units. Performance is 98%. Out of the 800 units, 780 were approved. Quality is 97,5%.
OEE = 0,85 (Availability) × 0,98 (Performance) × 0,975 (Quality) = 81%
That is the calculation. The difficulty does not lie in the mathematics. The challenge lies in measuring the right things, defining "planned production time" consistently, and managing changeovers, micro-stops, planned maintenance, and speed losses in a way that provides comparable figures over time. That is where most OEE projects are decided, not in the formula.
What is hidden behind the figure: 6 big losses
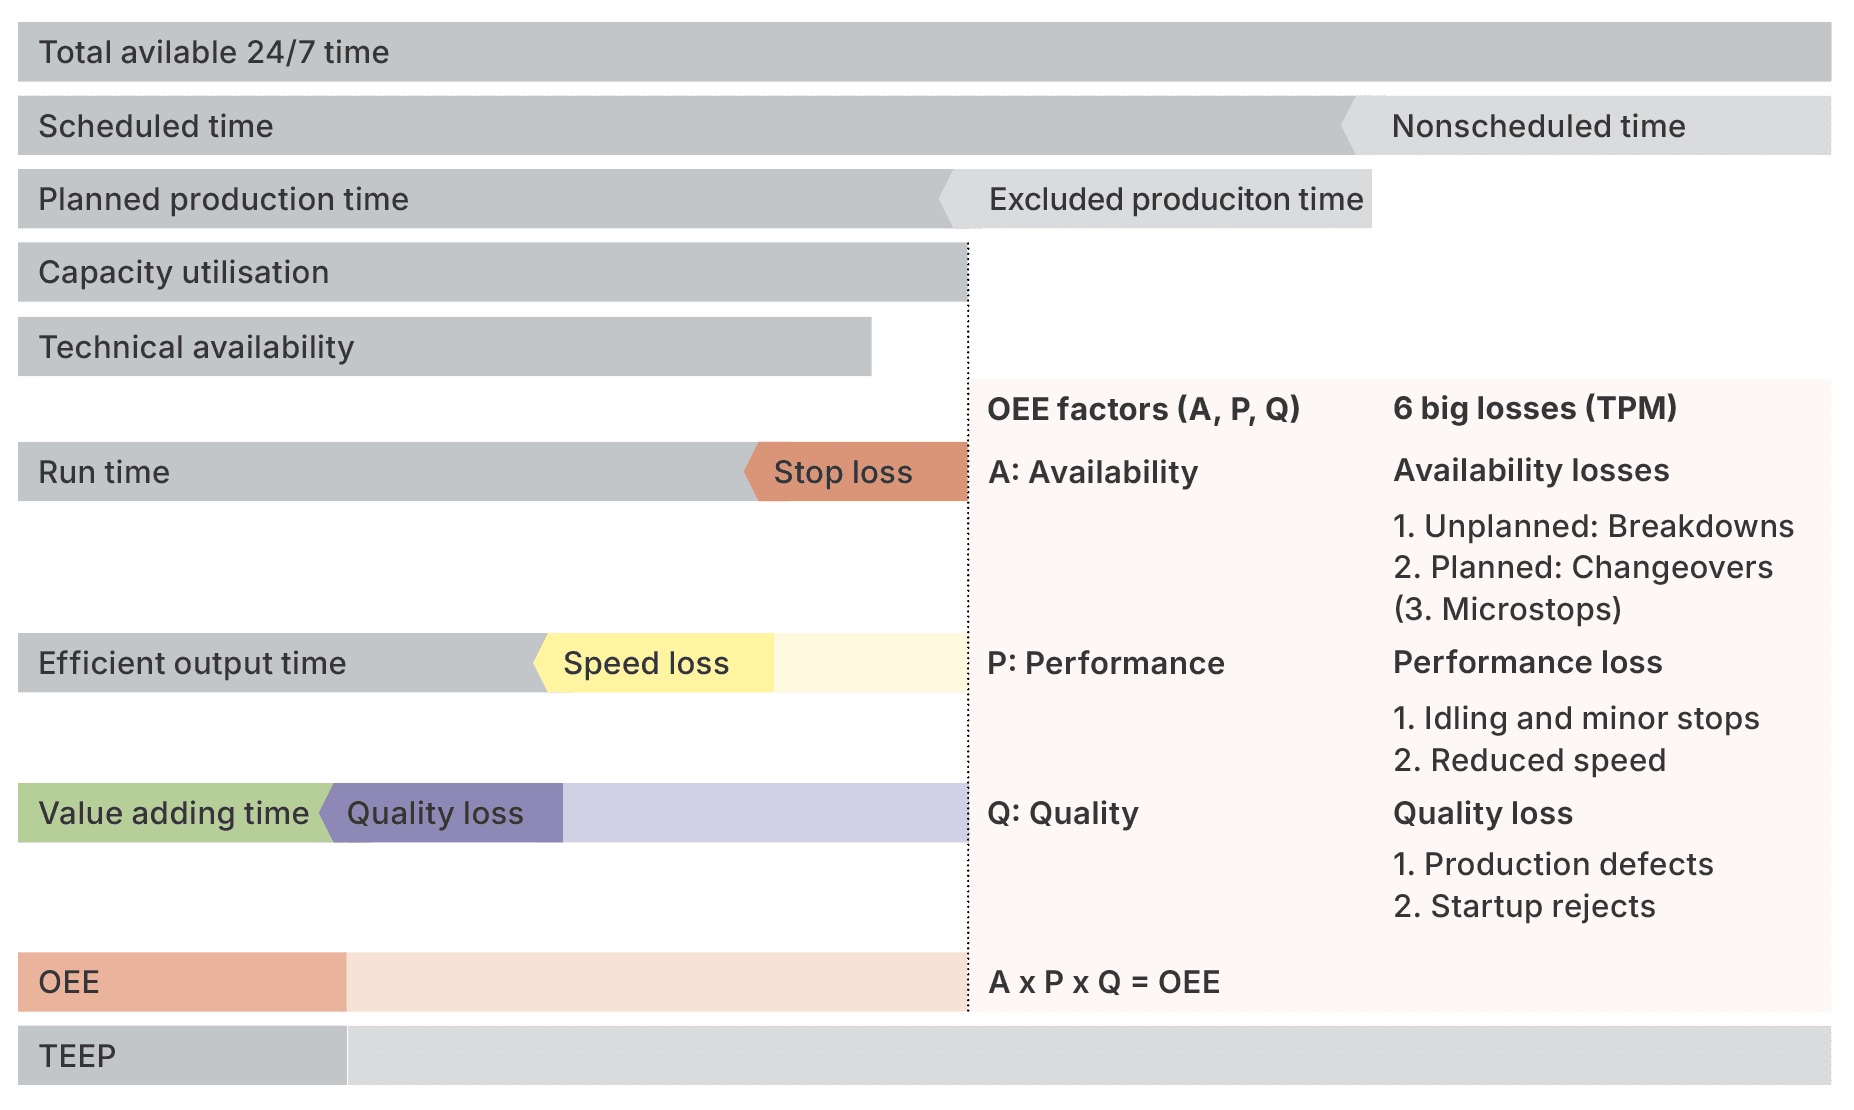
An OEE figure is a summary. For it to be useful, we need to know what is pulling it down. The TPM tradition identifies six major losses corresponding to the three OEE components.
Availability losses:
Breakdowns and unplanned stops
Changeovers and adjustments
Performance losses:
3. Idling and minor stops
4. Reduced speed
Quality losses:
5. Defects and rework in normal production
6. Startup defects
There is a seventh loss that deserves its own attention, although it is often managed as a subgroup of idling and minor stops. This is a micro-stop. Micro-stops are short interruptions lasting seconds or a single minute. A bottle that gets stuck, a sensor alarm, a sheet of paper that goes askew. Each one is negligible by itself. Collectively, they can account for a large portion of performance losses. They are hard to capture without automated data collection, as they are too short and too frequent to be registered manually.
Understanding these losses is the difference between an OEE figure that is merely reported and one that can be worked with. Without a link to the underlying losses, OEE becomes just a reporting figure. With a link, it becomes a tool for prioritising where improvement efforts will yield the most.
Is 85% OEE really world-class?
Many articles claim that 85% is "world class" and that factories should aim for it. The truth is that 85% is an abstract reference point that rarely reflects reality. In practice, the average OEE in the industry is significantly lower. Studies based on data from about 300 factories show an average of 50 to 60% in Northern Europe.
This means two things. First, most factories have huge potential for improvement without requiring new equipment or additional investment. The difference between 55% and 65% OEE corresponds to 18% more production from the same machinery. Second, the pursuit of 85% often becomes counterproductive. Production managers inflate the figure by excluding time that "does not count", such as changeovers, planned maintenance, and planned stops. The result is a figure that looks good but does not reflect real efficiency.
The question "What is a good OEE value?" has no universal answer. It depends on the industry, type of production, how the metric is defined internally, and what you compare it against. A more useful approach is to compare the factory with its own historical performance over time and focus on the direction of travel rather than an absolute figure from a textbook.
Different ways of measuring OEE
There are four common levels for collecting OEE data, ranging from simple to more advanced.
Manual collection. Operators record downtime and production manually, often on paper or in spreadsheets. It is easy to start with, but the data is often incomplete and difficult to trust over time. Micro-stops are rarely captured.
Semi-automated collection. The machine automatically reports production and stops, while the operator supplements this with reasons. This is often the most valuable level, as it combines reliable machine data with the operator's knowledge of why the stops occur.
Automatic collection from the machine's control system. Data is retrieved directly from the PLC or similar. It provides high precision in times and quantities, but cannot determine the cause of a stop on its own.
Integrated collection with ERP, MES, and maintenance systems. OEE data is connected to orders, articles, planning, and maintenance. It provides a more complete picture, but requires integrations to work and high data quality at all stages.
Most factories that achieve high OEE use a combination of automated collection of time and quantity data, supplemented by operator coding of causes. This ensures both precision and understanding.
What a good OEE system does, beyond calculating
An OEE system that only shows a number rarely helps a factory move forward. A system worth the investment visualises losses in real-time, while the stop is ongoing, so the right person can take action immediately. It supports the operators' work by making it easy to classify stops and register scrap. It enables deep loss analysis, so OEE can be broken down by line, article, shift, cause, and time. And it integrates with the rest of the operations, so OEE, quality, maintenance, and energy data can be viewed together.
It is these characteristics, not the length of the feature list, that determine whether a system creates value in daily operations. Simply put, it allows you to make better decisions faster and move from identifying production losses to implementing the right improvements and securing results over time.
How Good Solutions works with OEE
The Good Solutions platform is built on the principle that OEE should go from reporting to action. Measuring is the means, improvement is the goal. The platform combines machine connectivity, operator tools, dashboards, timelines, reports, quality management, maintenance, andon, energy, and operational implementation in one coherent tool. The platform currently supports about 300 factories, from individual production lines to global groups.
Machine connectivity is achieved via standard protocols such as OPC UA or a proprietary IoT solution, such as RS IoT 4G from Good Solutions, which collects operational data from various sources. RS IoT 4G can, for example, analyse machine vibrations, power consumption, other digital signals, or a standard 24 V connection. It works on both new and legacy machines and requires neither a local network nor IT support to get started. The data is sent directly to Good Solutions' cloud service via the industrial 4G network. This allows even older equipment to provide reliable OEE data, which is a prerequisite for improvement work to encompass the entire factory.
Sibbhultsverken improved OEE by 19,4% over 12 months. At Barilla Wasa, net production increased by 15% while CO₂ consumption decreased by 28%.
These types of results are not built by OEE measurement itself, but by the systematic improvement work that the platform makes easy to carry out.
Read more about how others have increased their factory productivity
FAQ
What is a good OEE value?
It depends on the industry, type of production, and how the metric has been defined internally. The industry average in Northern Europe is between 50 and 60%. The most important thing is not the figure in absolute terms, but the direction over time and the loss analysis. Comparing OEE against the factory's own history usually yields more than comparing against external benchmarks.
Is 85% OEE really world-class?
It is a widespread belief, but in practice, an abstract reference point. Few factories reach 85%, and those that report it have often defined away a large portion of the time. A more useful goal is to focus on the losses the factory actually experiences and improve OEE incrementally based on actual figures.
How do you calculate OEE for a shift?
Availability = operating time during the shift ÷ planned production time for the shift. Performance = (actual production × ideal cycle time) ÷ operating time. Quality = good units ÷ total units produced. The three are multiplied. The key is that definitions are consistent over time. Otherwise, it is impossible to compare figures between shifts.
What are the 6 big losses?
They are breakdowns, changeovers, idling and minor stops, reduced speed, defects in normal production, and startup defects. The first two reduce availability, the middle two performance, and the last two quality. Micro-stops are often counted as a seventh loss because they are hard to capture and often represent a large hidden loss.
Do we need a separate OEE system, or is our ERP enough?
ERP systems are built for business processes, such as orders, inventory, finance, and planning. They rarely have real-time data, machine connectivity, or the operator tools required for meaningful OEE work. A dedicated OEE system runs in parallel with the ERP and is integrated with it. The common division is that the ERP tracks what is produced, and the OEE system tracks how it is produced.
Take the first step towards increased productivity
Book a demo, and our experts will present a concrete plan to increase productivity, reduce resource use, and achieve profitability and sustainability targets.
Or call us and we'll help you
© 2026 Good Solutions Sweden AB
