
OEE
Why is OEE not enough as the sole KPI?
The OEE figure only shows that production is losing efficiency, but not why. The figure says nothing about the causes of the losses. OEE needs to be broken down and used as a basis for improvement work.
Text by Robin Ottenfelt · CMO
Fact-checked by Mikael Persson · Co-founder and CEO
Published · Last updated
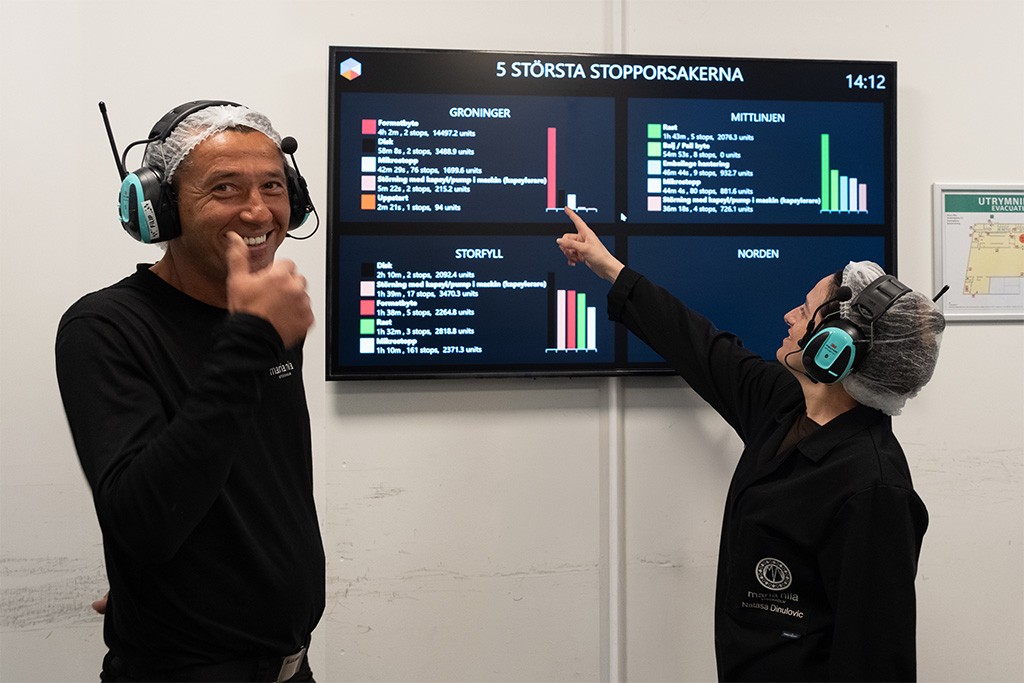
To create value, OEE needs to be broken down and used as a basis for improvement work.
OEE is not sufficient as a sole KPI because the figure shows that production is losing efficiency, but not why. It reveals nothing about the underlying causes of losses, it can be improved in ways that harm the operation, and it cannot be fairly compared across factories.
To create value, OEE needs to be complemented by loss analysis, quality metrics, changeover times, energy data, and flow metrics. Above all, it must be used as a basis for improvement work, not merely as a score on a screen.
This guide explains why OEE is not enough as a stand-alone KPI.
We explore the most common misconception about what actually halts production, three specific reasons why OEE becomes misleading on its own, what complementary metrics are required, and what is needed for OEE to deliver true value.
If you want the fundamentals first, feel free to read the article “What is OEE and how is it calculated?”.
Are production stops primarily a machine problem?
No. Data from factories that have worked structured with OEE over many years show that roughly 80% of stoppage causes are not directly machine-related. They stem from material shortages, changeovers, waiting for orders, quality issues, planning errors, shift handovers, and lack of operators. A common assumption is that downtime is predominantly caused by machine breakdowns, and that the remedy is better maintenance and smarter machines. The reality is quite different.
This has direct implications for how OEE should be interpreted. A low OEE figure says nothing in itself about where the issue lies. If 80% of losses are not located in the machines, a factory investing solely in better equipment and more maintenance will be disappointed with the results. The major potential lies elsewhere: in working methods, planning, material flows, and in the operators' insight into what is actually occurring on the shop floor.
It also impacts how data should be collected. Automated data capture from machines can confirm that a stop has occurred, but it rarely reveals why. Operators need to be able to code the root cause quickly and simply, the moment the stop happens. Otherwise, the bulk of losses ends up in the “Other” category, making it impossible to address. At Orkla Nidar, a Norwegian confectionery manufacturer since 1912, operators managed to eliminate the “Other” category from reporting as soon as they were provided with tools that made direct root-cause coding effortless.
What are the reasons why OEE is not enough as a sole KPI?
OEE is not enough on its own for three reasons: it reveals nothing about why losses occur, it encourages the wrong behaviours when used as the single metric, and it cannot be compared across different factories. Let us examine them in turn.
1. It says nothing about why
An OEE of 62% does not indicate whether the issue is due to breakdowns, changeovers, quality defects, or staffing. Without loss analysis, OEE is merely a thermometer showing a fever without a diagnosis. You know something is wrong, but not what, and therefore not what action to take.
Value only emerges when the figure can be broken down: by stop reason, by cause group, by line, by SKU, by shift, by machine component, and as a trend over time. Only then can you answer the questions that drive decisive action. Why does SKU A perform worse on Line 1 than on Line 2? Which downtime causes have increased over the past month? Which losses are frequent yet short? Which are rare but costly? It is in the breakdown, not the aggregate total, that continuous improvement finds its direction.
2. It encourages the wrong behaviours
When OEE becomes the only target, factories start to optimise the number rather than the operation. This is rarely intentional, but it happens.
A common example is deducting downtime as “unplanned/not to be counted” until the figure looks good, without anything actually improving. Another is running machines that should not be running, simply to keep availability numbers high. A third is cutting down changeovers by running larger batches. That raises OEE in the short term, but reduces agility, inflates stock levels, and ties up capital. The factory looks more efficient on paper while becoming less competitive in practice.
When a measure becomes a target, it often ceases to be a good measure. OEE is no exception. That is why it must be balanced against metrics for flow, on-time delivery, inventory, and quality.
3. It cannot be compared between factories
OEE values depend heavily on how “planned production time”, “ideal cycle time”, and stop reasons are defined. Two plants with differing definitions can have the exact same operational efficiency yet vastly different OEE figures—or the exact same figure despite substantial performance gaps.
Comparing OEE figures between different factories is therefore almost always misleading. Furthermore, it can damage the continuous improvement culture. When plants or shifts are ranked on a single metric, incentives arise to make the number look favourable rather than addressing root causes. Competition over a figure replaces collaboration on improvements. For an enterprise with multiple sites, this is a critical insight. Corporate tracking should focus on progress over time within each unit and on sharing best practices, not on benchmarking sites against one another.
What should OEE be complemented with?
OEE should be complemented with loss analysis by cause, quality metrics, changeover times, energy consumption per unit, and flow metrics. OEE should not be discarded, but supplemented, so that the operational picture is comprehensive and difficult to manipulate.
Loss analysis by cause. The foundation for making OEE actionable. Without it, OEE is a metric without an address.
Quality metrics. Scrap, rework, and quality deviations, preferably linked to SKU and root cause. Quality is not just a component of OEE; it is a distinct dimension worth tracking independently.
Changeover times. One of the most overlooked loss areas, and frequently one of the greatest levers for boosting available capacity.
Energy consumption per unit. An increasingly vital dimension, both for cost management and sustainability reporting. Energy per produced unit drops as OEE rises, linking these metrics closely.
Flow metrics. Lead time, work in progress (WIP), and on-time delivery. They capture elements OEE misses—especially the risk that high OEE is achieved at the expense of flow.
Together, they form a picture that is difficult to distort. That is the point. When multiple metrics point in the same direction, operational progress is genuine.
OEE requires multiple perspectives
What is required for OEE to deliver value?
Five factors determine whether OEE delivers value: data quality, operator involvement, daily management, in-depth loss analysis, and a structured implementation process. Experience from 300+ manufacturing plants shows a consistent pattern: technology is rarely the bottleneck.
Data quality. If operators do not trust the data, they will not use it for continuous improvement. This demands consistent definitions of planned production time, correct tracking of changeovers and planned stops, and clear stoppage codes that operators understand.
Operator involvement. Because 80% of stoppage causes are not machine-related, operators must be able to code them. This requires straightforward interfaces on the shop floor, not reports completed the following day.
Daily management. OEE becomes valuable only when applied in daily pulse meetings, shift handovers, and improvement sessions. A static number in a monthly report changes nothing.
In-depth loss analysis. Being able to break down OEE by line, SKU, shift, stop reason, and duration is the difference between passive reporting and taking action. Sibbhultsverken boosted OEE by 19.4% and cut technical downtime by 73% by working systematically over a full year, rather than relying on a one-off initiative.
Structured implementation process. Implementing an OEE system is not simply about installing software. It is about defining what to measure, ensuring reliable signals from machines and operators, and building shop-floor routines that actually leverage the data. Without this, the system merely becomes another information screen that nobody reviews.
How does OEE transition from a metric to continuous improvement?
OEE transitions from a metric to continuous improvement when the figure is applied within a recurring cycle of measuring, analysing, prioritising, acting, and following up. The common thread in all of this is that OEE is a tool, not a goal. The ultimate goal is to reduce production losses and operational costs, while increasing plant productivity. OEE is one of the most effective tools available to identify where losses occur, but the metric itself changes nothing.
This is why OEE belongs within a framework of continuous improvement—referred to in lean manufacturing as continuous improvement or kaizen. Measure, analyse, prioritise, act, review, and repeat. OEE and loss analysis supply the factual baseline. Continuous improvement work delivers the results. A factory that tracks OEE without a structured approach to improvement simply has a polished dashboard while the car remains stationary.
How does Good Solutions support this?
The Good Solutions platform is designed to move OEE from passive reporting to active execution. It is not just a measurement tool producing a figure, but a tool for driving continuous improvement across daily operations. The objective is practical: reducing production losses and costs by boosting factory productivity.
The platform unifies machine connectivity, operator tools, dashboards, timelines, reporting, quality management, maintenance, andon, energy monitoring, and operational rollout into a cohesive system. Operators, production supervisors, continuous improvement managers, and site leadership work from the same baseline of facts, each in a view tailored to their role. Loss analysis ensures the right initiatives are prioritised. The energy module allows cost and sustainability to be tracked within the same platform alongside production performance.
Equally vital to the software is the operational implementation. A proven process, guided by specialists with hands-on manufacturing experience, guarantees that data quality is maintained and operational routines are established. A dedicated support organisation and an assigned Customer Success Manager support the customer over time.
What results have customers achieved?
Kopparbergs Brewery reduced quality deviations by 68%. Bostik decreased changeover times by 70%. Barilla Wasa cut CO₂ consumption by 28% while raising net output by 15%. In all cases, the tangible gains are reflected in metrics beyond OEE alone: quality, changeover speed, and energy efficiency.
Learn more about how other manufacturers have boosted plant productivity
Frequently asked questions
Is OEE sufficient as the sole KPI for production?
No. OEE is powerful, but it says nothing about why losses happen. It should be complemented with loss analysis by cause, quality metrics, changeover times, energy consumption per unit, and flow metrics. Relying solely on OEE often leads factories to optimise the metric rather than the operation.
Why can we not compare OEE across our factories?
OEE values rely on how each site defines planned production time, ideal cycle time, and stop reasons. Two plants with differing definitions can have the exact same actual efficiency but entirely different figures. Instead, compare each site's trajectory over time, and use discrepancies to share lessons learned rather than establishing rankings.
What does it mean that 80% of stops are not machine-related?
It means the vast majority of production losses are caused by factors other than mechanical breakdowns: material shortages, changeovers, waiting for orders, quality defects, planning, and staffing. Consequently, a plant investing only in better machinery overlooks the greatest improvement potential, and accurate operator coding of stop reasons is crucial for eliminating losses.
How do we prevent staff from optimising the figures rather than the operation?
By never using OEE in isolation. When the metric is balanced against quality, changeover time, flow, and on-time delivery, it becomes difficult to artificially boost OEE in ways that harm overall performance. It is equally important to use OEE as an improvement tool rather than an evaluation grade for shifts or individuals.
How do we start using OEE for continuous improvement rather than just reporting?
Begin by ensuring data quality and providing operators with simple tools to log downtime causes. Next, integrate OEE and loss analysis into daily management routines—such as morning stand-ups, shift handovers, and weekly continuous improvement meetings. Prioritise a few specific losses at a time, implement solutions, and follow up. It is within this continuous rhythm that OEE converts reporting into tangible results.
Read more
What is OEE and how is it calculated?
OEE consists of three multiplied subcomponents: Availability × Performance × Quality. For example, 85% availability, 98% performance, and 97.5% quality result in an OEE rate of 81%.
How are setup times reduced in production?
Reduce changeover time by measuring downtime accurately. Use the SMED method to separate and convert internal to external steps, as well as streamlining each individual step. By shifting preparation work to when the machine is running, downtime is minimised.
Take the first step towards increased productivity
Book a demo, and our experts will present a concrete plan to increase productivity, reduce resource use, and achieve profitability and sustainability targets.
Or call us and we will help you
© 2026 Good Solutions Sweden AB