
OEE
How do you calculate the ROI of an OEE system?
Your ROI comes from five savings: higher output from the same machinery, lower downtime costs, less scrap and rework, shorter changeover times, and lower energy consumption per unit.
Text by Robin Ottenfelt · CMO
Fact-checked by Mikael Persson · Co-founder and CEO
Published · Last updated
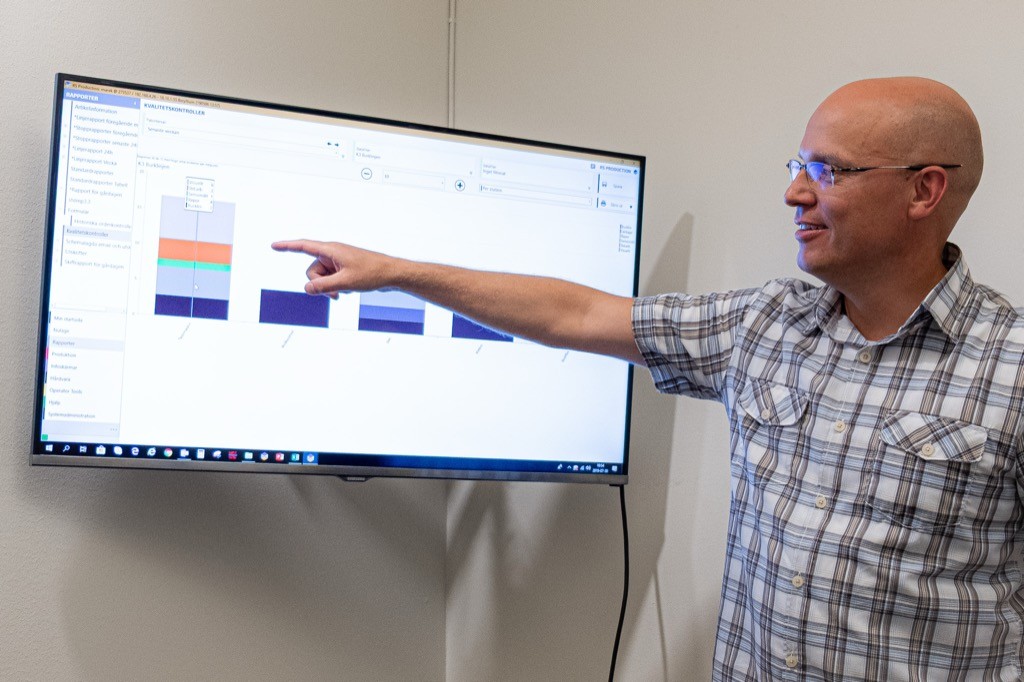
A return on investment for an OEE system is achieved through improvement work, not through measurement itself
The question arises sooner or later in every OEE project. Often from the CFO. Sometimes from the CEO. Sometimes it is the production manager who wants to be certain before the decision is made.
What is the return on investment, and how long does it take? The question is important, as there are examples of systems that have cost more than they delivered. Perhaps because they are not used due to being too cumbersome to operate, or because they have remained mere reporting tools without any connection to daily operations.
This guide demonstrates how to build a credible and sound business case or ROI calculation. Which savings can actually be realised, which assumptions hold up and which do not, how to avoid inflating the calculation, and how to present the figures in a manner that withstands scrutiny.
The fundamental principle: an OEE system delivers returns through continuous improvement, not through the measurement itself. The platform is the tool you pay for. The improvements are what you get back.
Where does the money come from?
The financial return stems from five levers: higher output from the existing machine fleet, lower stoppage costs, reduced scrap and rework, shorter changeover times, and lower energy consumption per unit produced. The relative scale among them varies by industry and baseline, but the total is often surprisingly substantial.
1. Higher output from the existing machine fleet
The largest lever in most factories. A typical OEE level of 50 to 60% means that 40 to 50% of machine time is non-value-adding. Moving OEE from 55 to 65% yields 18% more production from the same machinery, the same operating hours, and the same personnel.
For a plant that would otherwise need to run an extra shift, hire more operators, or invest in new equipment, this is often the single largest item. It grows larger the closer the plant already operates to its capacity limit.
A line produces 8,000 good units per shift at 44% OEE. If OEE increases to 57%, with unchanged planned production time, product mix, and ideal cycle time, this corresponds to approximately 10,364 good units per shift. The calculation is 8,000 × 57/44. That is an increase of approximately 29.5%.
If demand remains unchanged, the improvement can instead reduce the required production time. Whether an entire shift can be eliminated depends on production volume, manning levels, bottlenecks, and scheduling.
2. Lower stoppage costs
Stoppages cost more than what appears in an OEE report. Every hour of downtime entails unutilised labour, continuing fixed costs, energy consumed without producing output, and delivery risks that can escalate into express freight or lost orders.
Calculating the cost of a stopped machine hour is one of the most valuable exercises in a business case. It varies significantly across industries, but a rough rule of thumb is that the hourly cost of a production line is often 2 to 5 times higher than the direct operator costs. Depreciation, facilities, energy, and management overheads all accrue during downtime.
At Sibbhultsverken, technical stoppages were reduced by 73% and unplanned downtime by 63%. In one cell where they curtailed losses, OEE improved by 19.4% in just 12 months. In another cell, OEE increased by 40%.
3. Reduced scrap, rework, and quality losses
This item is systematically underestimated. When a product is scrapped or reworked, you have already paid for raw materials, energy, labour time, and in many cases, packaging. Scrap is not merely the raw material cost; it encompasses the entire manufacturing sequence up to the point where the defect was detected.
At Barilla Wasa in Filipstad, product waste was reduced by 15% when the platform was implemented and the improvement work began. At Kopparbergs Brewery, quality deviations fell by 68%. Both figures translate directly into financial savings and provide better capacity utilisation across the existing machinery.
4. Shorter changeover times
Changeovers are one of the most concealed loss areas. They are planned, visible on the schedule, and often not classified as “stoppages” in the same manner as breakdowns. However, a changeover during which the machine stands idle for three hours represents three hours of unutilised capacity.
At Bostik in Helsingborg, which manufactures adhesives and sealants with over 80 products in the same plant, changeover times on the filling lines fell by 70% following systematic work applying the Lean Six Sigma DMAIC framework (Define, Measure, Analyse, Improve, Control). OEE improved by 40%. One of the key insights was that two operators collaborating completed the changeover faster than two working separately on individual machines. Platform metrics made this difference visible.
5. Lower energy consumption per unit produced
Energy has shifted from an overhead background expense into executive management reports. Higher OEE can reduce energy consumption per good unit, as fewer stoppages and lower scrap yield more conforming units for the same energy input. The effect must be verified by measurement. Added to this is direct work on idle energy draw and benchmarking between comparable machines. Clipping peak loads can also reduce demand charges, even if overall kilowatt-hour consumption does not decline.
A factory with €100 million in turnover can realistically save approximately €125,000 per year on energy by combining productivity improvements with targeted energy initiatives. Carbon impact is reduced by 60 to 80 tonnes of CO2e. For many organisations, this is also a line item that feeds into sustainability reporting and strengthens brand value.
How do you build the business case?
Structure the business case in six parts: define an honest baseline, set quantified targets within realistic ranges, calculate annual savings broken down across the five levers, summarise year-one capital investment, state ongoing costs from year two onwards, and calculate the payback period and net present value. This structure performs well in most board and management presentations.
Baseline (status quo). Define key performance indicators prior to project start. OEE per line, total downtime hours per month, scrap and rework costs, changeover duration per SKU change, energy cost per unit produced. This constitutes the benchmark against which the entire calculation is measured. Without an honest baseline, improvement cannot be proven.
Quantified targets. Specify realistic ranges rather than single point estimates. For example: an OEE uplift of 5 to 15 percentage points over 12 months. A 10 to 25% scrap reduction. Changeover times 30 to 50% shorter. Benchmark against peers in the same industry rather than outlier success stories.
Projected annual savings, broken down across five levers. Aggregate these into a total annual saving. Maintain consistency: if the OEE increase already accounts for reduced downtime, do not double-count stoppage costs in the same calculation.
First-year investment cost. Software licences, IoT hardware if required, deployment, training, and internal staff time. Include internal labour hours, which should be factored into total cost.
Ongoing costs from year two onwards. Software subscriptions, support, and potential hardware expansions. This is the running cost to be weighed against sustained annual savings.
Payback period and net present value. Payback period is often the first figure executive management looks for. Net present value over a three- or five-year horizon provides a more balanced assessment. Apply the company’s standard hurdle rate.
Which assumptions hold up in the calculation?
Assumptions that hold up reflect progressive gains over time: modest OEE increases in year one, scrap reductions as loss analyses mature, and changeover improvements taking 6 to 12 months. Assumptions that fail rely on rapid miracles, such as a 50% OEE improvement within six months. The most frequent error is treating the best case as if it were the expected case.
Assumptions that hold up:
OEE improvements in the lower ranges for year one (5 to 10 percentage points), rising in years two and three once working methods are embedded.
Scrap reduction keeping pace as loss analysis capabilities mature.
Changeover reductions taking 6 to 12 months to become broadly established.
Energy reductions tracking the availability of data and execution of corrective actions.
Assumptions that fail:
A 50% OEE improvement within the first six months. This rarely happens, except from a very low starting base.
Scrap reductions without prioritising root-cause quality analysis. Scrap does not decrease on its own.
Energy savings without machine-level monitoring. You cannot optimise what you do not visualise.
Assuming the entire organisation will abruptly change working habits upon system go-live. Behavioural change takes time.
Model the business case across three scenarios: pessimistic, realistic, and optimistic. Defend the realistic scenario. That is where alignment with management is secured.
From unlocked time to financial value
- Which loss can be reduced?
Calculate the improvement relative to a documented baseline.
- How can capacity be utilised?
Assess demand, bottlenecks, and whether released time can actually be converted.
- What financial impact results?
Distinguish marginal contribution from expenses that can actually be eliminated.
- What does execution cost?
Account for rollout, internal labour hours, and ongoing costs.
What is the cost of doing nothing?
Doing nothing carries a cost in eroded competitiveness. While operations remain static, competitors are raising their capacity. The status quo carries an expense that rarely appears on the income statement, yet remains very real.
If a competitor improves OEE from 55 to 65% while you remain static, they have unlocked 18% more capacity from the same machine park. They can accept orders you cannot fulfil. They can apply price pressure you cannot match. They can invest in next-generation assets while you are still making the case for this step.
If your customers report under CSRD, they may request energy and emissions data from you. Lacking structured energy data, you will need to establish a parallel reporting framework, which is both costlier and less effective than holding data within the same system as operational performance monitoring.
Information security carries increasing weight in supplier evaluations. Choose an ISO 27001-certified provider so the platform does not present an obstacle during procurement audits by Tier 1 clients.
Factoring in the cost of inaction, even as an estimate, makes the business case more robust. It proves that the alternative is not “saving the investment”, but rather “gradually surrendering competitiveness”.
How do you avoid an inflated business case?
Avoid inflated claims by doing three things: anchor metrics in your own operational reality, assign clear ownership to every figure, and continuously measure and adjust. This distinguishes a resilient business case from one that unravels.
Anchor figures in your operational reality. Use your plant's actual downtime, scrap expenses, and changeover durations. Grounded figures carry more authority than outsized gains reported by external sites.
Assign clear ownership to every figure. Who owns the delivery of the OEE gain? Who is accountable for scrap reduction? Who drives the changeover improvement? Without designated owners, the model remains an academic document rather than an operational plan.
Continuously measure and adjust. The business case is not a one-off exercise. Review progress monthly in the first year, and quarterly thereafter. Adjust targets when operational reality shows they were set too conservatively or too ambitiously. This sustains the improvement programme and ensures payback is delivered.
How Good Solutions supports the business case
The Good Solutions platform is designed to drive continuous improvement in daily production operations. That is where returns are realised. Machine connectivity secures robust baseline data. Operator interfaces, dashboards, and automated reports make this data actionable across the organisation, from the shop floor to executive meetings. Visual timelines and loss analyses ensure interventions are prioritised effectively. The energy module allows cost reductions and sustainability targets to be monitored in the same platform.
Operational rollout is just as crucial as the software itself. The platform is delivered with expert guidance from consultants with practical manufacturing experience, a dedicated Customer Success Manager for long-term support, and a Nordic-based support organisation. Practical experience from implementations across 300+ factories ensures business cases are constructed realistically from day one and tracked in partnership with the client.
Among realised outcomes: Kavli produced 5,000 tonnes more in 2024 than in the preceding year without introducing extra shifts or machinery. Derome Timber improved OEE by 10% in six months, delivering the equivalent of over 250 additional lorry-loads of finished goods annually from their Kinnared mill. These results are built systematically through daily operational improvements.
Discover how other manufacturers have increased plant productivity
Frequently asked questions
What does an OEE system cost?
Pricing depends on several factors, including the number of connected machines, user counts, the required functional modules, and the rollout scope. Good Solutions operates a comprehensive subscription model covering software, IoT hardware, cloud infrastructure, support, and regular updates.
What is a typical payback period?
This depends on the baseline and the speed with which new working routines are established. The lower the initial OEE, the greater the upside. The more mature the organisation's existing continuous improvement practices, the faster the platform converts into financial returns. Structure the assessment around pessimistic, realistic, and optimistic scenarios.
What should be measured before project launch?
Establish a baseline for at least four metrics: OEE per line, total downtime hours per month, scrap and rework costs, and changeover duration per SKU change. For many facilities, energy consumption per unit produced is also essential. Without a documented baseline, subsequent gains cannot be quantified.
How should internal labour time be factored into the investment?
Account for hours spent by operators, production management, continuous improvement engineers, maintenance technicians, and IT during rollout. For a mid-sized facility, internal time typically spans 100 to 300 hours across the implementation phase. Apply a realistic fully burdened hourly rate and incorporate this figure into the total investment cost.
What happens if the targets are not met?
The most common cause is that daily operational routines failed to adopt the improvement processes. In such cases, the system becomes an advanced reporting repository rather than a driver of continuous improvement. Ongoing progress reviews, ideally conducted alongside the software partner, ensure bottlenecks are identified early and appropriate corrective measures are deployed.
Read more
What is OEE and how is it calculated?
OEE consists of three multiplied subcomponents: Availability × Performance × Quality. For example, 85% availability, 98% performance, and 97.5% quality result in an OEE rate of 81%.
How do you select the right OEE system?
Start with the outcome you want to achieve, not with a feature list. Ensure the system is easy to use, supports daily management, provides reliable data, delivers deep loss analysis and real-time visibility, matches your machine fleet, integrates with other systems, and is scalable.
Take the first step towards increased productivity
Book a demo, and our experts will present a concrete plan to increase productivity, reduce resource use, and achieve profitability and sustainability targets.
Or call us and we will help you
© 2026 Good Solutions Sweden AB