
OEE
How do you ensure data quality in an OEE system?
Reliable OEE data requires the correct schedule, cycle times, machine signals, production counts, and downtime causes. With a clear control routine, the factory can identify deficiencies before they affect capacity planning and improvement decisions.
Text by Robin Ottenfelt · CMO
Fact-checked by Mikael Persson · Co-founder and CEO ·
Published · Last updated
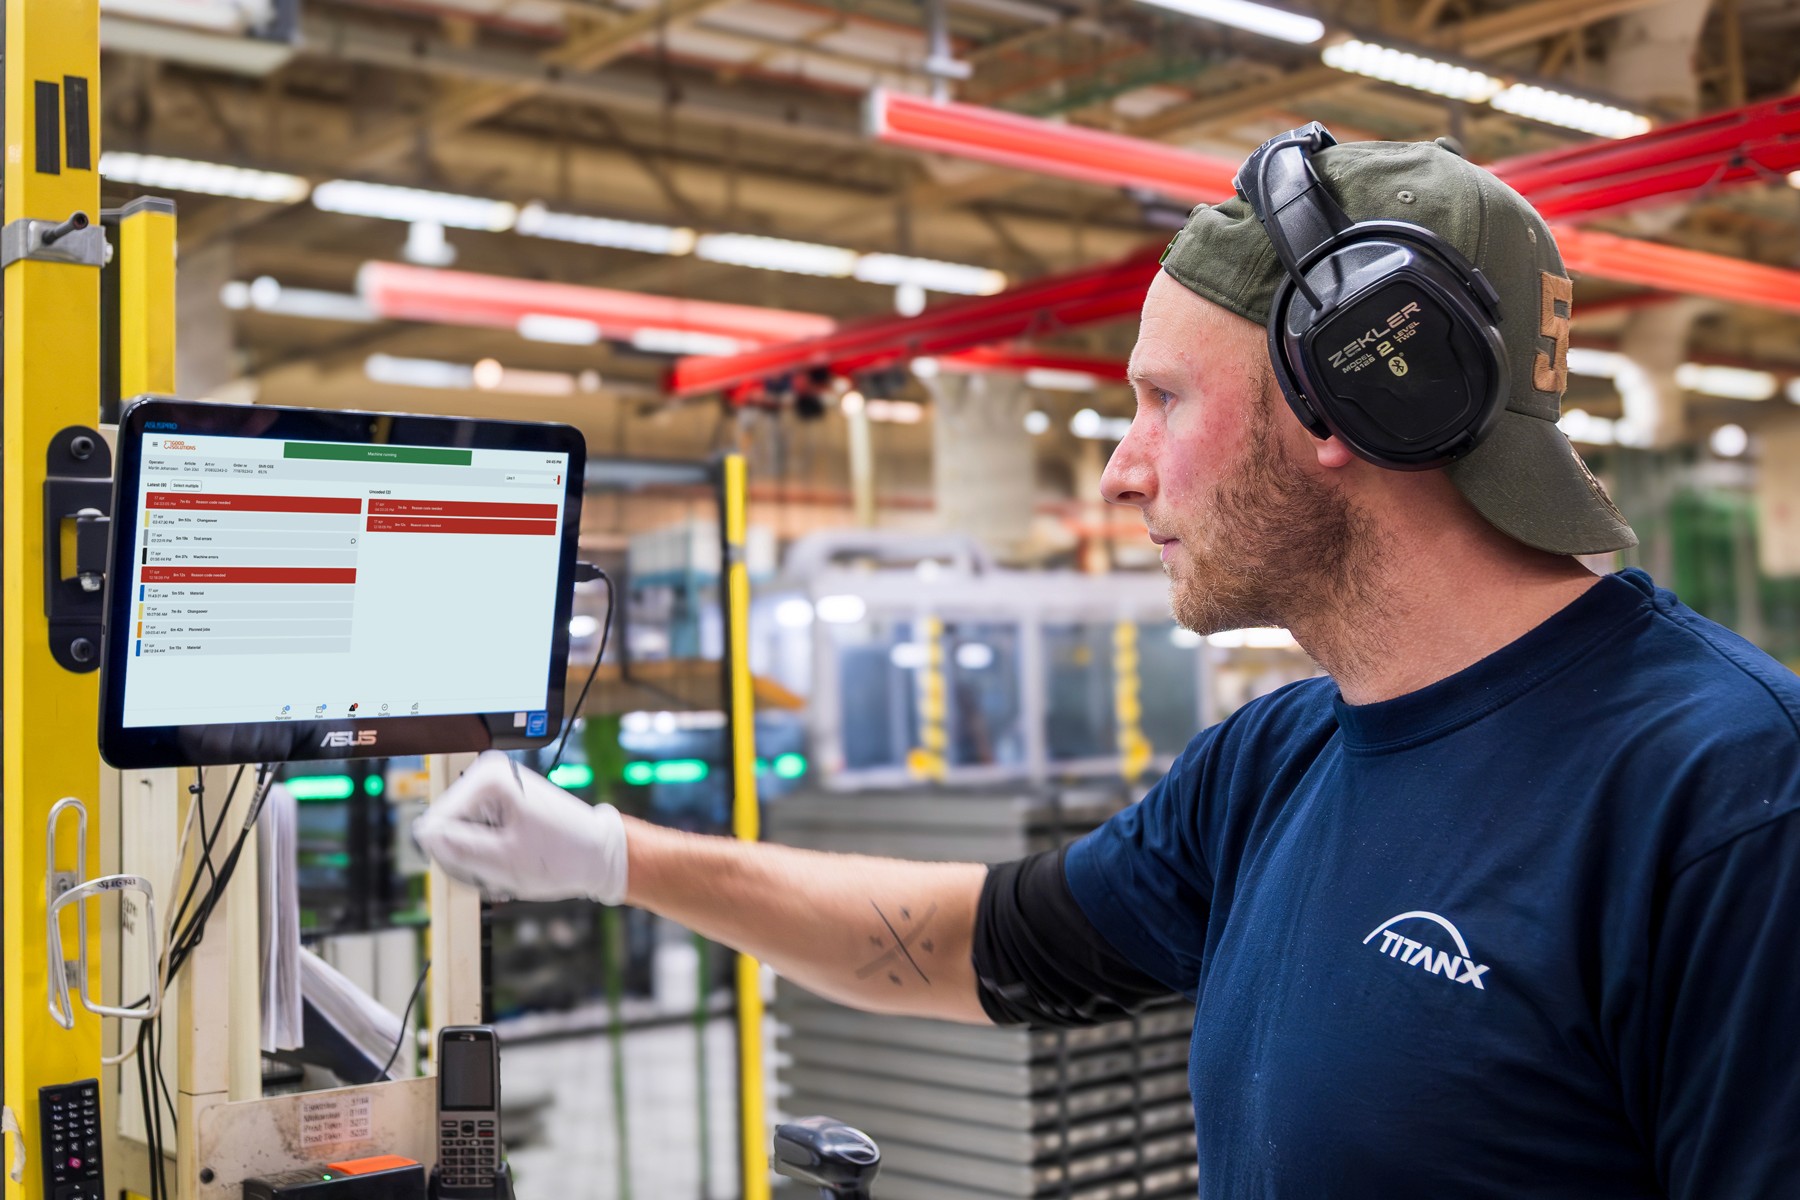
Machine data needs to be supplemented with clear reason codes and checks of times, quantities, and item details.
A line shows better OEE than before, yet the team sees no difference on the shop floor. Have losses actually decreased, or has a schedule, cycle time, or machine signal changed?
Data quality determines whether performance tracking can be used for decision-making. It must be checked both during implementation and whenever production, parts, or working methods change. The validation routine needs to cover both machine signals and the entries that people log or amend.
What does data quality mean in OEE tracking?
Data must reflect what actually occurred, based on common definitions. Times and quantities must be accurate, events must be assigned to the correct machine, order, and part, and reason codes must provide sufficient detail to prioritise action.
A calculation can be mathematically correct and still misrepresent reality. If planned production time is set too short or the ideal cycle time too long, you get a higher OEE without a corresponding output improvement.
Therefore, document your measurement rules in an OEE policy. For a walkthrough of the calculation, read what OEE is and how it is calculated.
Six checks before using data for decisions
1. Are the schedule and planned production time correct?
Compare system times against the actual production plan. Verify shift boundaries, breaks, overtime, maintenance, and unmanned time. Production outside the schedule or an entire shift without logged activity must be accounted for.
Suggested owner: production management or planning. Verify during schedule changes and follow up deviations in the daily routine.
2. Are the correct part, order, and cycle time linked to the run?
Verify order start, order changes, and ideal cycle times per part and machine. Investigate values that shift abruptly or generate performance figures above 100 per cent. When reviewing cycle times, you also need to know how many units each machine cycle produces.
Suggested owner: superuser together with production or process engineering. Verify new parts, tooling changes, and amended master data.
3. Do machine signals capture actual run and stop states?
Observe a defined production run at the machine and compare it with the system log. Check when run state starts and ends, whether micro-stops are recorded, and if signal drops or duplicate counts occur. A cycle signal and a run signal represent different things and must be interpreted according to the process.
Suggested owner: technical lead and superuser. Verify during commissioning, machine modifications, and unexpected data patterns.
4. Do total and good unit counts match?
Compare logged quantities against an independent verification source, such as a reconciled order or physical counter. Confirm that units of measure match. Define how scrap, rework, and post-shift quality releases affect the counts.
Suggested owner: production and quality. Conduct regular spot checks and investigate runs with unusual quality yields.
5. Are downtime reasons sufficiently complete and clear?
Track uncoded downtime and frequent use of generic codes such as "Other". A high coding rate is ineffective if codes are inaccurate or overly broad. Check also whether different shifts record the same incident differently.
Suggested owner: operators log and production supervisors review. The superuser maintains the downtime reason tree alongside users.
6. Are results comparable with earlier periods?
Check whether schedules, product mix, staffing, cycle times, or measurement standards have changed. Separate these operational shifts from the true impact of an improvement initiative. Any changed metric must be scrutinised before being taken as evidence of improvement.
Suggested owner: continuous improvement lead and the owner of the OEE definitions. Conduct this check prior to performance reviews and following master data changes.
Validate data before making decisions
Six checks on the data underpinning OEE.
Every deviation requires an owner
What needs correcting? Who is doing it? When is the outcome verified?
Checklist for routine validation
For every audited asset and period, document the following:
Schedule: does recorded operating time align with the plan and actual running time?
Order and part: are runs matched correctly?
Cycle time and volume: are the ideal cycle time, units per cycle, and unit of measure accurate?
Signals: do logged run states, downtime, and piece counts match observations?
Quality: are good production, scrap, and rework numbers accurate?
Reasons: is there uncoded time, ambiguous codes, or repeated miscoding?
Comparability: have definitions or operational baselines changed?
Action: what needs correcting, who owns it, and when will the result be verified?
Classify each item as verified, deviation, or unverified. This makes it clear which data can be used immediately and where further validation is needed.
How often should you run checks?
Align the routine with the pace of change in your operations and data sources. A practical start is to review uncoded downtime and order variances daily, examine recurring patterns and spot checks weekly, and verify master data after any operational change.
During implementation, checks may need to be more frequent. Once tracking has stabilised, reviews can focus on deviations. Always maintain a clear owner for every check.
What should you do when data is uncertain?
Isolate the affected assets, fields, and time periods. Document what is uncertain and avoid using it as a precise basis for capacity commitments or proven improvements. Rectify according to established routines and validate the outcome against physical observations or other verified data.
Do not fill gaps with assumptions masquerading as measured values. If estimates are required for preliminary planning, label them clearly so they remain distinct from actual measurements.
How can Good Solutions' platform support this work?
Good Solutions' platform combines machine data with operator reason codes and comments. Production tracking by order and part, along with shift reports, timelines, and analytics, provides the basis to review events and recurring patterns. Available features depend on your plan and configuration.
Operational onboarding includes configuration, data verification, and training. Post-launch, the plant must establish owners and routines for ongoing validation. Learn more about the OEE system in Good Solutions' platform and loss analysis.
Frequently asked questions
Can automatically captured OEE data be inaccurate?
Yes. Signals can drop or be misinterpreted, piece counts can register twice, and schedules or cycle times may be misconfigured. Automated capture must be verified against real-world shop floor events.
What should we examine if performance exceeds 100 per cent?
Check the ideal cycle time, units per cycle, logged production count, operating time, and assignment to the correct part. An over-100% value signals a need to review input data and calculation rules.
Is it enough that all downtime events have a reason code?
No. Codes must also be accurate, understandable, and granular enough to drive action. Monitor both uncoded time and the overuse of generic categories.
Who owns data quality?
Distribute ownership by source: schedules to planning, signals to the technical lead, quality to the quality team, and downtime coding to operations. A designated lead must coordinate the overall process.
Read more
What is loss analysis and how do you use it in production?
Loss analysis involves breaking down production losses by cause, line, article, shift, and time, so that the factory knows exactly where capacity and money are being lost. The analysis is what makes an OEE figure useful: the figure shows that losses exist, while the analysis shows where, when, and why. It is the loss analysis that allows improvement efforts to be targeted at the most costly losses first, rather than those that are simply the most visible.
How do you select the right OEE system?
Start with the outcome you want to achieve, not with a feature list. Ensure the system is easy to use, supports daily management, provides reliable data, delivers deep loss analysis and real-time visibility, matches your machine fleet, integrates with other systems, and is scalable.
Take the first step towards increased productivity
Book a demo, and our experts will present a concrete plan to increase productivity, reduce resource use, and achieve profitability and sustainability targets.
Or call us and we will help you
© 2026 Good Solutions Sweden AB